Current Reverse Mortgage Rates: Today’s Rates, APR | ARLO™
HECM Reverse Mortgage Rates
Fixed Rate Payment Options: Lump Sum
Fixed Rate Adjustable Rate 2024 Lending Limit
7.560% (8.955% APR) 6.920% (1.750 Margin) $1,149,825
7.680% (9.090% APR) 7.170% (2.000 Margin) $1,149,825
7.810% (9.288% APR) 7.420% (2.250 Margin) $1,149,825
7.930% (9.427% APR) 7.670% (2.500 Margin) $1,149,825
Adjustable-Rate Payment Options: Lump Sum, Line of Credit, Term, Tenure, Combination.
APR Illustration: 7.560% + .50% Monthly MIP = 8.060% in total interest charges. Assumes $250,000 loan amount and includes .50% Mortgage Insurance, standard 3rd party closing costs.
HECM Purchase Reverse Mortgage Rates
Fixed Rate Payment Options: HECM for Purchase Transactions (H4P)
Fixed Rate Adjustable Rate 2024 Lending Limit
7.560% (8.955% APR) 6.920% (1.750 Margin) $1,149,825
7.680% (9.090% APR) 7.170% (2.000 Margin) $1,149,825
7.810% (9.288% APR) 7.420% (2.250 Margin) $1,149,825
7.930% (9.427% APR) 7.670% (2.500 Margin) $1,149,825
APR Illustration: 7.560% + .50% Monthly MIP = 8.060% in total interest charges. Assumes $250,000 loan amount and includes .50% Mortgage Insurance, standard 3rd party closing costs.
Adjustable-Rate Payment Options: HECM for Purchase Transactions (H4P), Line of Credit, Term, Tenure, Combination.
Index: 12-Mo. CMT
Lifetime Cap: 5% Over Start Rate
Jumbo Reverse Mortgage Rates
Fixed Rate Payment Options: Lump Sum
Fixed Rate Adjustable Rate Lending Limit
9.490% (9.983% APR) 11.795% (6.625 Margin) $4,000,000
9.740% (10.268% APR) 11.920% (6.750 Margin) $4,000,000
10.375% (10.954% APR) 12.045% (6.875 Margin) $4,000,000
Jumbo APR Illustration: Assumes $1,000,000 loan amount, includes standard 3rd party closing costs.
Adjustable-Rate Payment Options: Lump Sum or Line of Credit
Index: 12-Mo. CMT
Lifetime Cap: 5% Over Start Rate
TIP #1: If you are shopping for the best reverse mortgage interest rate, be sure first to compare the program’s payment options, which are explained in detail below.
Many prospects first gravitate to a fixed rate but find the mandatory lump sum unattractive compared to the flexibility of a line of credit option or monthly payment plans featured on variable interest rate options.
How Interest Rates Affect Your Available Loan
You may have heard of recent changes to the Federal Housing Administration-insured reverse mortgage program, the Home Equity Conversion Mortgage (HECM) program. The agency announced in late August that it would be making several changes to HECM loans that will impact borrowers- both in terms of how much they will pay to get a reverse mortgage and how much they’ll be able to borrow.
One of the significant changes is that the amount you can borrow with a HECM loan depends largely on current interest rates. The amount of home equity you can borrow is tied directly to the interest rate available when you get your reverse mortgage.
Just like in the “forward” mortgage market, your interest rate determines the interest you’ll pay. However, the current interest rate determines how much you can borrow in the reverse mortgage market. All HECM reverse mortgages use a specific table the Department of Housing and Urban Development provides to determine loan amounts for borrowers. This amount is called the “principal limit.”
The principal limit depends mainly on the borrower’s age, home value, and current interest rates. Every loan amount will be different from home to the borrower to borrower.
The percentage of home equity that borrowers can access will range from 35-60%. Older borrowers can access a greater percentage of home equity than their younger counterparts.
2024 Reverse Mortgage Eligibility and Benefits by Age
*Principal Limit Factors taken from HUD.gov using an example expected rate of 6.255%. To arrive at your NET principal limit, you must deduct reverse mortgage costs, including upfront insurance (approx. 3%). PLF tables source: https://www.hud.gov/sites/documents/august2017plftables.xls
Age of Borrower Principal Limit Factor Current Lending Limit
62 34.5% $1,149,825
65 36.6% $1,149,825
70 40.3% $1,149,825
75 43.2% $1,149,825
80 47.7% $1,149,825
85 54.0% $1,149,825
90 61.0% $1,149,825
TIP #2: Each Monday afternoon, the expected rate updates are taken from the daily treasury yield curve and create an adjustment to all HECM lenders’ software and their principal limit factors.
When you compare lenders’ rates & origination fees, be sure to receive written quotes within the same calendar week, preferably Tuesday-Friday. This will give you the most accurate side-by-side interest rate comparison.
Types of Reverse Mortgage Payment Options
Reverse mortgage Fixed Rates
- Payment options: Single lump sum disbursement.
- Interest rate: Fixed rate for the life of the loan. The interest rate remains the same for the life of the loan but requires a single lump sum disbursement at the time of closing.
If you are using the reverse mortgage for purchase or are already taking most of your available funds at closing to pay off another mortgage balance, you might find this plan the most appealing.
Reverse mortgage Adjustable-rates, or ARMs:
- Payment options: Single lump sum disbursement, line of credit, term, tenure.
- Interest rate: Annual adjustable with a periodic change of up to 2% with a lifetime cap rate of 5% over the start rate.
Generally, interest rates are slightly lower than fixed-rate mortgages but offer greater flexibility with additional payment plans such as the open line of credit, term, and tenure plans.
The adjustable rate plans come as either monthly or annual adjustable.
Choosing Fixed-Rate Vs. Adjustable
You can choose a fixed rate or an adjustable rate, and fixed rates sound great, but they are called a “closed-end instrument” and require the borrower to take the entire loan at the beginning of the transaction. For borrowers who are paying off an existing mortgage and need all their funds to pay off the current loan, this is no problem.
For a borrower with no current lien on their property or a very small one, this would mean they would be forced to take the entire eligible mortgage amount on the day the loan funds. This might give a borrower $200,000, $300,000, or more in cash from the very first day that they do not need at the time and on which they are accruing interest.
A borrower planning on using only a portion of their funds monthly need not pay interest on the entire amount from the very start, eroding the equity unnecessarily fast. This can also have an adverse effect on some seniors with needs-based programs. (Medicaid: Seniors on Medicaid and some other needs-based programs would have their eligibility impacted by the sudden addition of liquid assets.)
An adjustable-rate will accrue interest at a much lower rate at today’s rates but has a 5% lifetime cap and can go much higher if rates continue to rise.
Also, See: Which is Best? Fixed vs. Adjustable Rate Reverse Mortgages
Adjustable Rates Offer Greater Flexibility
The adjustable-rate programs do allow you more flexibility in how you can receive your funds. The first option would be a cash lump sum. This is not advised on the adjustable product, as a cash lump sum request is usually associated with fixed interest rates. However, it is available.
The second option would be a line of credit. The HECM line of credit differs from the “Home Equity Lines of Credit” or (HELOC) lines of credit you can get at your local bank. The reverse mortgage line of credit funds grows based on the unused portion of your line, and those funds cannot be frozen or lowered arbitrarily as the banks can and have done recently on the HELOCs.
This means that the line of credit grows based on the interest rate applied to the unused portion of your line. In other words, using that same $100,000 line we had above, if you used $45,000 to pay off an existing lien and for your closing costs, you would have $55,000 left on your line. If you did not use these funds, your line would grow by the same rate as your interest plus your MIP renewal rate on the loan.
If your interest rate was currently 5% and your MIP renewal was .5%, your line would grow at 5.5%. That would be roughly $3,025 in the first year (with compounding, it would be higher). The credit line growth is not interest anyone is paying you. It is a line of credit increase, and if you never use the money, you never accrue any interest owing on the growth.
After several years of growth, some borrowers’ lines grow significantly because their lines started relatively high and don’t begin drawing on the lines until later in the loan.
The third option would be a payment plan.
With a reverse mortgage, borrowers also have the option to take the net proceeds in the form of monthly payments that are disbursed every month. These funds can be allocated for life (tenure) or for a specific time period (term). If a borrower opts for a tenure payment, the payments would continue every single month for as long as the borrower lives in the property and the loan is in good standing even if they outlive their life expectancy. If you opt for a term payment, the payments will cease once the term period has elapsed.
Lastly, a reverse mortgage borrower can combine any of these options in what would be considered a modified payment plan. For example, a reverse mortgage borrower could receive funds disbursed at closing while allocating funds to a line of credit and funds to a monthly payment plan. The amount of each would be dependent upon interest rates in effect, the age of the youngest borrower or spouse, and the amount of net principal funds available to be allocated.
How Interest Rates & Margins Affect the Principal Limit
One of the things that can determine the amount for which borrowers will ultimately qualify is the rate at which the loan accrues interest. When the margins on the adjustable rates were lower and the fixed rate was higher, the adjustable rates gave borrowers more money in their pockets in the form of eligibility.
Most borrowers who run the numbers receive more money on the adjustable rate program. Knowing if you are trying to get as much as possible to pay off an existing lien is extremely important.
It also means that the higher the margin, the less money the borrower will receive, and the faster interest on the loan will accrue. So, the thing to look for in a reverse mortgage is the rate on a fixed rate or the margin on an adjustable rate being quoted.
TIP #3: An increase in future interest rates may not necessarily be a bad thing, especially for those with the line of credit plan, as a rise in future rates is also matched in the guaranteed line of credit growth rate.
E.g., if your interest rate rises by 1%, your LOC growth rate will increase by the same rate. The higher rates go, the larger your line of credit will grow!
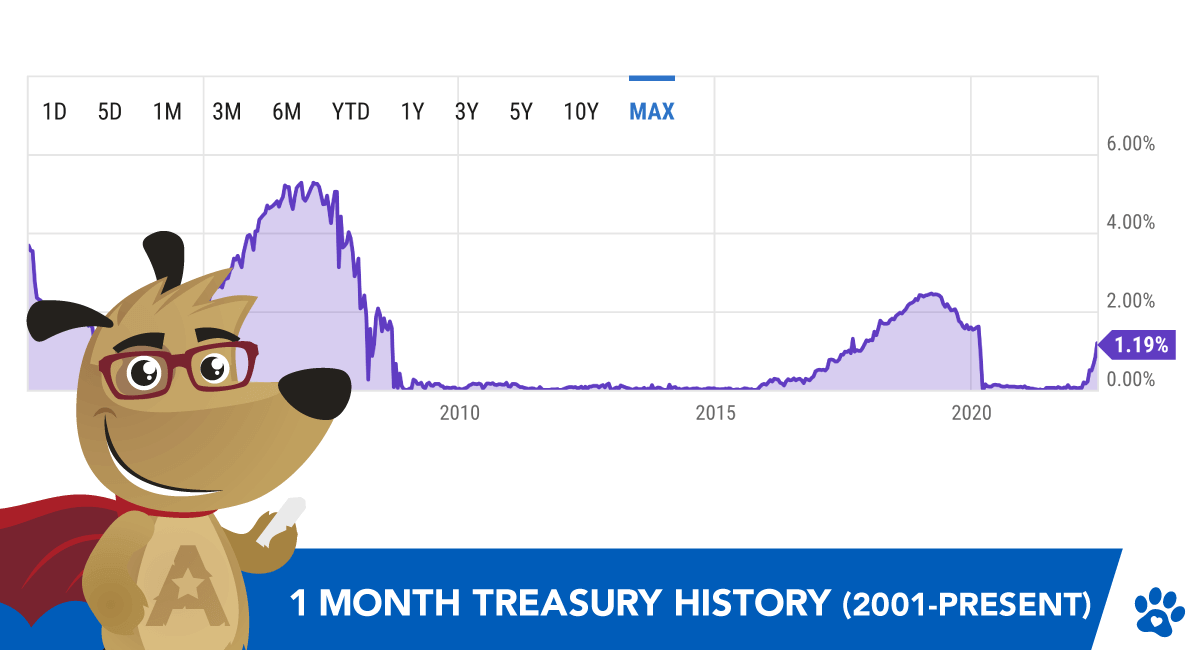
Treasury Index History
The CMT Index stands for the Constant Maturity Treasury Index. It is based on an average monthly yield of a range of Treasury Securities adjusted to a constant maturity equivalent to a one-year maturity.
The U.S. Treasury determines the yields on Treasury securities at the constant maturity from the daily yield curve. That curve is based on the closing market bid yields for actively traded over-the-counter Treasury securities.
GNMA announced in September 2020 that it would no longer allow the LIBOR index to be used for HECM loans, effective February 1, 2021, and lenders quickly moved to the CMT index. Ultimately, lenders and HUD wanted to replace the LIBOR index with the new SOFR index, but the SOFR index was not ready in time, and the move was made back to the CMT to eliminate the LIBOR.
The SOFR is the Secured Overnight Financing Rate, which is the cost of borrowing cash overnight collateralized by Treasury Securities and cannot be manipulated as was supposed to be the case of the LIBOR. Once it became known that the LIBOR rate was subject to manipulation, the rate was dropped as a financial staple for adjustable rate loans, and a major antitrust class action suit was filed. There are currently more than a dozen individuals on trial for serious financial crimes.
The CMT is a long-standing and trusted index, and the SOFR is also an index that is beyond manipulation.
Where we are now:
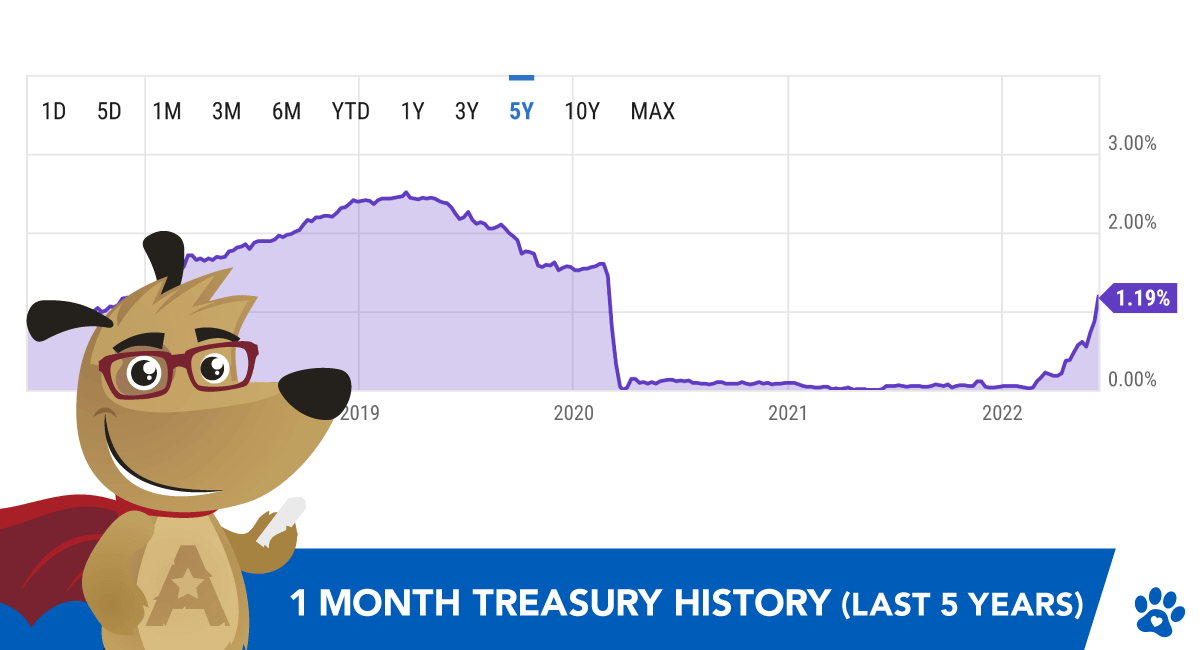
Index Rate Resource: 1 Month Treasury Chart (Last 5 Years)
Interest Rate FAQs
What is the current interest rate for a reverse mortgage?
Presently, the lowest fixed interest rate on a fixed reverse mortgage is 7.560% (8.955% APR), and variable rates are as low as 6.920% with a 1.750 margin. Disclaimer: interest rates are subject to change without notice.
How do interest rates affect reverse mortgages?
How does the margin work on a variable reverse mortgage?
Reverse mortgage lenders will adjust your interest rate by adding the margin to the corresponding index. E.g., if you have an adjustable rate every month, the lender will adjust your current interest rate by taking the 1-year CMT index value and adding it to your margin. At the time of application, you can negotiate the lender’s margin, which usually comes with upfront costs that vary depending on the type of loan. Generally, the lower the margin, the higher the initial closing costs.
When is the rate locked on a reverse mortgage?
The actual note rate cannot be locked until the loan closing. However, your expected interest rate on an adjustable loan is locked in at application for 120 days. This allows your loan’s value to be locked in even if rates were to move up before your final lock at closing.
Can you make monthly payments on a reverse mortgage?